Summing up the ‘state of working’ in India
In a ‘State of Working in India’ report by the Centre for Sustainable Employment shows that a 10% increase in GDP now results in less than one per cent increase in employment


A 10% increase in GDP now results in less than one per cent increase in employment. Even as GDP growth rates have risen, the relationship between growth and employment generation has become weaker over time. In the 1970s and 1980s, when GDP growth was around 3-4%, employment growth was around 2% per annum. Since the 1990s, and particularly in the 2000s, GDP growth has accelerated to 7% but employment growth has slowed to 1% or even less. Between 2013 and 2015, total employment actually shrank by seven million. More recent data from private sources show that the absolute decline has continued past 2015. As a result, the rate of unemployment among the youth and higher-educated has reached 16%.
It used to be said that India’s problem is not unemployment but underemployment and low wages. But a new feature of the economy is a high rate of open unemployment, which is now over 5% overall, and a much higher 16% for youth and the higher educated. The increase in unemployment is clearly visible all across India, but is particularly severe in the northern states.
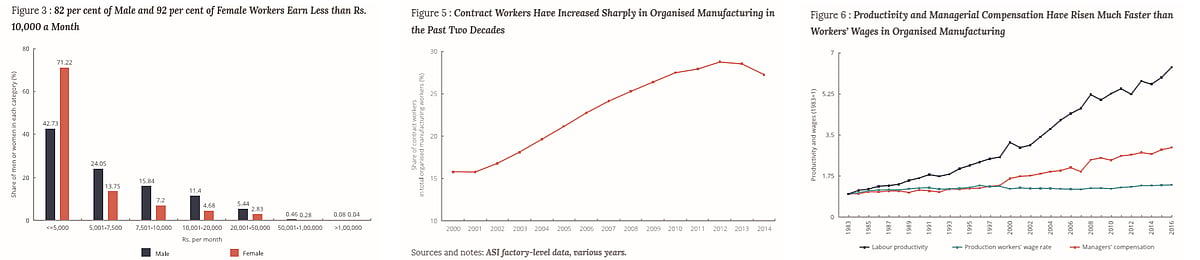
India’s low earnings problem continues despite wage growth in the recent past. Nationally, 67% of households reported monthly earnings of up to ₹10,000 in 2015. In comparison, the minimum salary recommended by the Seventh Central Pay Commission (CPC) is ₹18,000 per month.
This suggests that a large majority of Indians are not being paid what may be termed a living wage, and it explains the intense hunger for government jobs. Even in the organised manufacturing sector, 90%of the industries pay wages below the CPC minimum. The situation is worse in the unorganised sector. A field study in West Bengal shows that even multiple informal occupations do not fetch women a living wage.
For example, one woman undertook tailoring, brick kiln work, daily labour, and mid-day meal cooking to earn ₹ 2,700 a month while another performed brick kiln work, daily labour, sand mining, and agricultural work to earn ₹6,800). Another study in Rajasthan shows that skilled stone cutters earn significantly less than the already low state minimum wage, for highly hazardous work in an export-oriented industry.
In the early 1980s, one crore rupees of real fixed capital (in 2015 prices) supported around 90 jobs in the organised manufacturing sector. By 2010, this had fallen to 10.
The last ten years have been good for the sector, and most industries have performed well on either the wage or the employment front. A few big employers, like knitwear, plastics, and footwear, have posted strong employment growth as well as strong wage growth. An increase in employment in organised manufacturing was an opportunity to provide decent, remunerative, and stable employment.
But instead, the share of contract work and other precarious forms of labour have grown since the early 2000s. Field studies reveal many categories of contract, trainee, and apprentice workers who perform the work of permanent workers at a fraction of their wages. This is one way in which labour laws are being circumvented by manufacturing firms.Another way is via underreporting of workers.
Labour productivity in organised manufacturing increased by six times over the past three decades but wages increased by only 1.5 times. One might expect that as labour productivity grows, wages will grow in tandem. In neither the organised nor the unorganised sector is this the case. The divergence is stark in the organised sector. Labour productivity is over six times what it was in 1982, but production workers’ real wages have grown by only about 1.5 times).
Even the growth of managerial and supervisory salaries is much slower than productivity growth. As a result of this, the labour share of income in organised manufacturing has collapsed to around 10%.
Employment in the new service sector, including IT and modern retail, increased from 11.5% in 2011 to 15% in 2015. However, more than 50% of service sector employment is still made up of petty trade, domestic services and other types of small-scale and informal employment Further, it is possible that the current downsizing in IT-BPM is not a temporary phenomenon but reflective of structural shifts, posing further challenges to the narrative of service-led structural change.
Caste disparities remain large Caste-based segregation and disparities persist, but have reduced in some areas. SC as well as ST groups are over-represented in low paying occupations and severely under-represented in the high paying occupations
While only 20 women are in paid employment for every 100 men in UP, this number is 50 in Tamil Nadu and 70 in the north-east. The percentage of working age women who are either employed or looking for work is low in India compared to many other developing countries.
And it has been declining over time (Box 2.3). But the southern and north-eastern states show much higher rates of participation by women than the northern and western states. The ratio of female to male labour force participation rate varies from less than 0.2 in Uttar Pradesh and Punjab to 0.5 in TN and AP, to a more than 0.7 in Mizoram and Nagaland.
Caste-based segregation and disparities persist, but have reduced in some areas. SC as well as ST groups are over-represented in low paying occupations and severely under-represented in the high paying occupations, a clear indication of the enduring power of caste-based segregation in India.
On the other hand, both SC and ST groups are much better represented in public administration indicating the success of reservation policies over the years. SCs earn only 56% of upper-caste earnings. The figure is 55% for STs and 72% for OBCs. The SC gap narrows to around 0.7 when level of education is taken into account. But there is need for much more empirical work, especially at the jati level, to reach a better understanding of caste disparities.
With over 500 officially listed arts and crafts, the sector represents immense cultural value, ecological positives, and millions of jobs. Workers leaving agriculture are mainly moving to construction. The craft sector can provide much needed rural employment that is ecologically less destructive, and that enhances existing skills instead of destroying them. But for this to happen the sector must be treated on par with other industries and given infrastructural support.
Join our official telegram channel (@nationalherald) and stay updated with the latest headlines