Opinion
World Bank estimates of India's poverty and employment are way off the mark
The World Bank, which relies on government data, has been busy hailing India’s record in reducing poverty and increasing employment
The World Bank, in a report in April 2025, had spoken of a dramatic decline in poverty in India between 2011 and 2023. In a recent brief, reported widely by the Indian mainstream media, the World Bank once again hailed India's sharp reduction in poverty, driven by economic growth, rising consumption, expanding employment and social protection. The World Bank claimed that India’s experience offers important lessons for developing countries.
Those below the extreme poverty line of $3 per day are supposed to have declined from 27.1 per cent of the population in 2011 to 2.6 per cent in 2023. It also notes a massive increase in employment. It attributes the decline in poverty to a rise in consumption, but flags high youth unemployment, employment concentration in low-productivity activities and broadly unchanged real earnings. How do these World Bank figures square with the plight of the crisis-ridden unorganised sector in India, which employs 94 per cent of the workers?
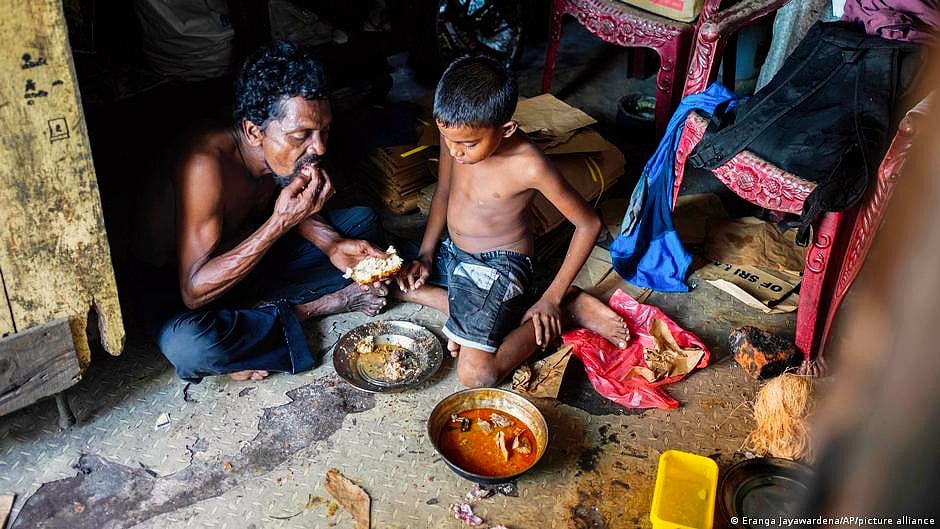
As many as 310 million unorganised sector workers are registered on the e-Shram portal, according to the PM, and 90 per cent of them reported an income of less than Rs 10,000 per month. These are actually the better-off workers, with access to a computer. In April this year, the protesting workers in Noida and other places, working in decent establishments, also said they earned around Rs 10,000 per month. During the pandemic, 84 per cent of workers said they did not have savings to last even a week without work. That is how precarious the existence of most Indian workers is.
Poverty estimation: Several issues arise regarding the World Bank report on poverty and inequality in India. First, the World Bank is not a data-gathering agency. It takes government data and interprets it, thus reproducing errors in the official data.
For instance, surveys in India typically miss the poor and the very rich living in gated colonies, which is true of India’s consumption surveys. So, poverty and inequality appear to be lower in government data. The huge black economy, concentrated in the hands of the top 3 per cent of the population, is a key reason for inequality, but that does not get captured in the data.
Second, do Indians report their data correctly? This author’s experience of field surveys is that some report less so as to get government support, while others exaggerate for reasons of prestige. But, by and large, the poor have confused recall. Thus, the shift from an earlier visit to a household by the surveyor to the last three visits often captures widely divergent data, making the data non-comparable.
Third, the World Bank defines an international poverty line. This is an average applicable across nations in a given category. But is that applicable to India, given that poverty is defined as ‘socially minimum necessary consumption’? Does that average apply to India? For instance, a poverty line for Ladakh cannot be the same as for Tamil Nadu, so the all-India average will not be a true measure of poverty in either state.
Estimation in dollar terms is relative: Fourth, the World Bank’s poverty estimate for a country is presented in dollar terms for comparison across countries. So, a country’s standardised consumption basket representing poverty in its own currency is converted into dollar terms by estimating the cost of that basket in the US. The dollar used is not the nominal dollar obtained from foreign currency exchanges. Instead, the purchasing power parity dollar (PPP$) is used.
***
This raises three more issues. First, if prices of essentials rise more in the US (say, energy) than in India, Indian consumption is taken to have risen in comparative terms and Indian poverty will appear to be lower. Second, as argued by this author, the PPP$ measure is relevant to the middle and upper classes, who consume the cheap services provided by the poor, but does not apply to the poor. This is because the poor hardly consume the cheap services they provide to well-off Indians.
A maid does not employ a maid, just as a worker making hamburgers does not eat the hamburger. Since the poor mostly consume essentials that are internationally traded, such as food and energy, it is the nominal dollar that should apply to the poor. Finally, the quality of services such as education and healthcare available to an Indian poor person cannot be compared with what a US citizen gets.
Disparities remain: The World Bank report also says, “Wage disparities … remain pronounced, as median earnings among the top 10 per cent of workers were about 13 times higher than the bottom 10 per cent in 2023.” But the real disparities are between income from capital and labour, and not between different categories of wage earners. Moreover, high incomes of businessmen are not captured because of non-response and evasion. A large part of their incomes is in black and is not reported or captured in tax data. So, the real disparity in India — in consumption or income — cannot be captured using official data, and this plagues the World Bank’s analysis too.
Unemployment: The World Bank says, “between 2017 and 2023, employment increased by about 134 million people, nearly twice the growth of the working-age population”.
Where do these figures come from? In 2023, those crossing the age of 15 years to enter the labour force were born in 2008, when the population was 1.2 billion. The 2011 Census showed a birth rate of 2.18 per cent. Subtracting infant mortality and assuming that most deaths occur in old age, those entering the working-age population would number 26 million. In the six years between 2017 and 2023, the working-age population would increase by about 156 million, not the 67 million assumed by the World Bank.
The World Bank also fails to account for underemployment, disguised unemployment and those who have stopped looking for work. So, the backlog of employment for these workers needs to be added to the requirement for employment among those entering the labour force upon crossing the age of 15.
The NITI Aayog report in August 2026, which says that 87 million Indian youth (aged 15 to 29) are neither in education nor in employment (NEET), is telling. And many of those in employment have been forced back into farming and self-employment at low or zero wages. This situation is deteriorating due to automation and mechanisation, even in agriculture.
The World Bank report’s claims on poverty and inequality, therefore, are problematic.
Data for the vast unorganised sector is not adequately captured in official statistics, and that masks poverty. This sector was hit hard by demonetisation in 2016, faulty GST in 2017, the NBFC crisis in 2018, the sudden lockdown in 2020, and the wars in Ukraine and West Asia in the following years. As a result, workers in this sector have lost far more income than they have received in freebies. So, their consumption could not have risen in spite of free rations.
Moreover, the World Bank glosses over the sharp rise in healthcare and education costs due to privatisation, while the quality of these services remains largely abysmal. ASER reports since 2005 have flagged this in education, and the pandemic exposed the weaknesses in health infrastructure for the poor.
Other essential services, such as drinking water and energy, are also of indifferent quality. Often, workers do not get the wages shown on paper, and one illness in the family pushes them into poverty. Due to widespread corruption, they have to incur expenditures that are not captured in surveys — such as money spent to obtain an Aadhaar card or, now, a voter ID card, or the hafta they pay to policemen and officials to ply their trade.
Arun Kumar is a retired professor of Economics at JNU and author of Indian Economy’s Greatest Crisis: The Impact of the Coronavirus and the Road Ahead. More of his writing here